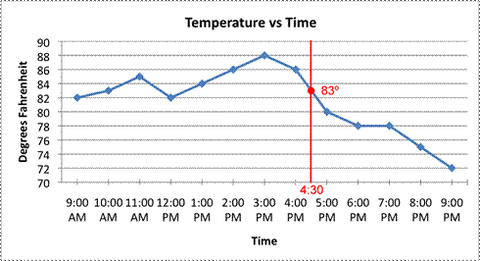
This week on Skill Sunday we are going to be learning about how to visualise data captured using Arduino. As fantastic as the Arduino IDE can be, it doesn’t provide an easy way to graph data that you receive from sensor inputs on your Arduino projects. Wouldn’t it be awesome to be able to visualise in real time how the light levels inside your house have changed over time? Or be able to track fluctuations in temperature or humidity? Instructables member CrtSuznik has put together a neat set of instructions which outline how you can send data from your Arduino into Excel and visualise it. To find out more check out the following link.

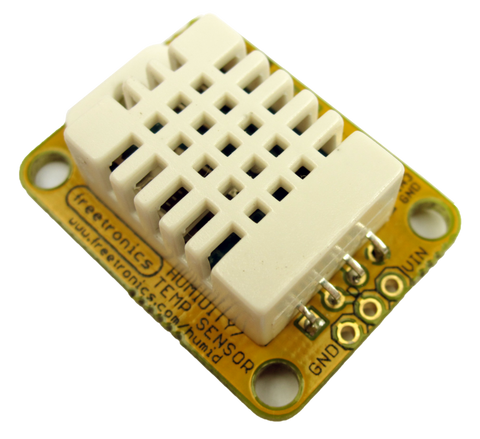
Looking for a sensor so that you can begin capturing and visualising data? Why not check out the Freetronics Humidity and Temperature Sensor Module?

The module only requires three wires: GND, power and data. This means that it is very easy to get started recording temperature and humidity data! The find out more visit the product page.
Think that this was a useful skill to learn about? Have an idea for next weeks Skill Sunday? Let us know in the comments section below or on Facebook and Twitter.


